php
46 lines · 6 steps
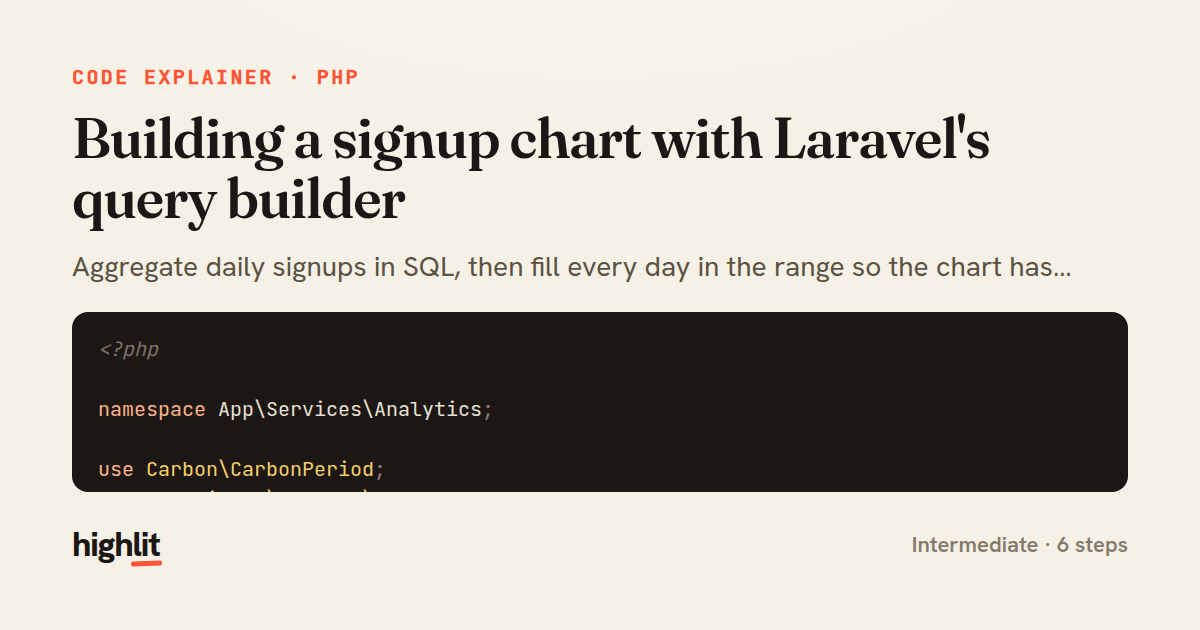
Building a signup chart with Laravel's query builder
Aggregate daily signups in SQL, then fill every day in the range so the chart has no gaps.
Explained by
highlit
1<?php
2
3namespace App\Services\Analytics;
4
5use Carbon\CarbonPeriod;
6use Illuminate\Support\Carbon;
7use Illuminate\Support\Facades\DB;
8
9class SignupChartBuilder
10{
11 public function build(int $days = 30): array
12 {
13 $start = Carbon::today()->subDays($days - 1);
14
15 $counts = DB::table('users')
16 ->selectRaw('DATE(created_at) as day, COUNT(*) as total')
17 ->where('created_at', '>=', $start)
18 ->groupBy('day')
19 ->orderBy('day')
20 ->pluck('total', 'day');
21
22 $labels = [];
23 $data = [];
24
25 foreach (CarbonPeriod::create($start, Carbon::today()) as $date) {
26 $key = $date->toDateString();
27 $labels[] = $date->format('M j');
28 $data[] = (int) ($counts[$key] ?? 0);
29 }
30
31 return [
32 'labels' => $labels,
33 'datasets' => [
34 [
35 'label' => 'Daily signups',
36 'data' => $data,
37 'fill' => true,
38 'tension' => 0.3,
39 'borderColor' => '#4f46e5',
40 'backgroundColor' => 'rgba(79, 70, 229, 0.1)',
41 ],
42 ],
43 'total' => array_sum($data),
44 ];
45 }
46}
01 / 01
STEP 01
‹ swipe to step through ›
Walkthrough
Space play
←→ step
click any line
Three takeaways
- 1Group and count in the database instead of pulling raw rows and tallying in PHP.
- 2Iterate the full date range so days with zero activity still appear on the chart.
- 3Shape server data into the exact structure your charting library expects.
Related explainers
php
<?php

class NameParser
{
Parsing a full name into components in PHP
string-parsing
arrays
normalization
Intermediate
8 steps
php
<?php

namespace App\Services\Checkout;
Validating coupons with Laravel's Pipeline
pipeline
chain of responsibility
transactions
Intermediate
7 steps
php
<?php

namespace App\Services;
How a password strength validator works in PHP
validation
regular-expressions
data-driven
Intermediate
8 steps
ruby
class LogAggregator
  BUCKET_FORMAT = "%Y-%m-%dT%H:%M"

  def initialize(entries)
Bucketing log entries by the minute in Ruby
aggregation
hashing
enumerable
Intermediate
5 steps
ruby
class WeeklySignupsReport
  DEFAULT_WEEKS = 12

  def initialize(weeks: DEFAULT_WEEKS, source: User.all)
Building a weekly signups report in Rails
service object
aggregation
group by
Intermediate
7 steps
php
<?php

namespace App\Services;
Building a cached daily leaderboard in Laravel
caching
aggregation
eager-loading
Intermediate
9 steps
Share this explainer
Here's the card — post it anywhere.
Made with highlit — turn any snippet into a walkthrough like this in about a minute.
Explain your code
Embed this explainer
Drop the interactive walkthrough into a blog or docs. Views never cost a credit.
<iframe src="https://highlit.co/explainers/building-a-signup-chart-with-laravel-s-query-builder-explained-php-5eb2/embed?autoplay=1" width="100%" height="520" loading="lazy" style="border:0"></iframe>
Autoplay is on by default — add ?autoplay=0 to start paused.