javascript
31 lines · 8 steps
Rendering a sparkline as SVG
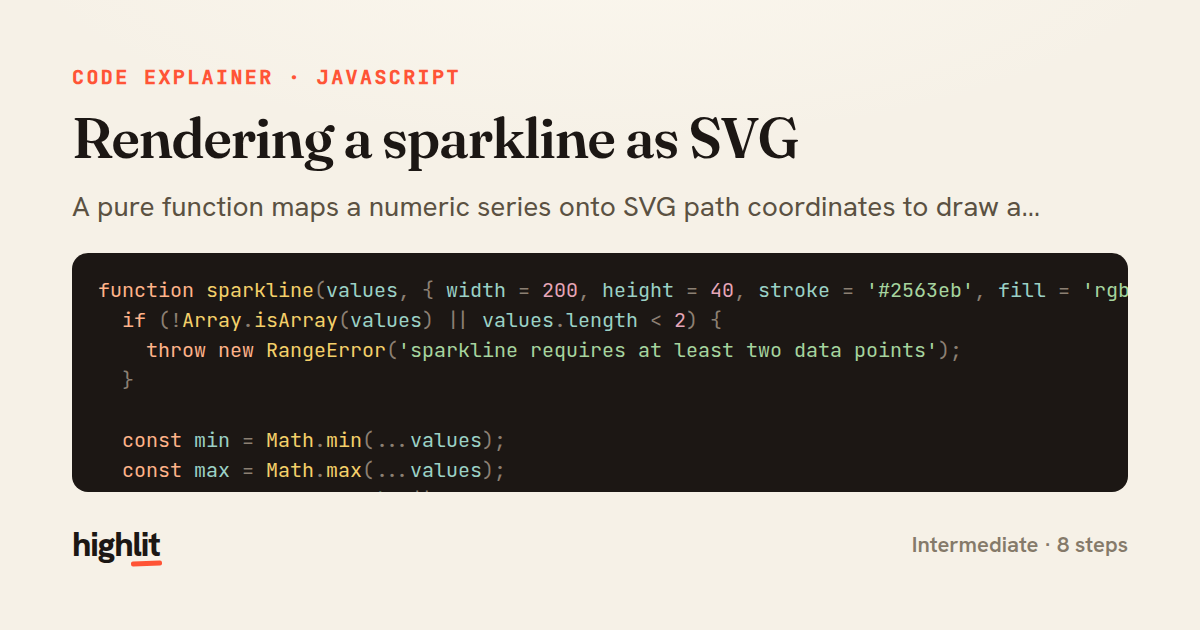
A pure function maps a numeric series onto SVG path coordinates to draw a compact inline chart.
Explained by
highlit
1function sparkline(values, { width = 200, height = 40, stroke = '#2563eb', fill = 'rgba(37,99,235,0.12)' } = {}) {
2 if (!Array.isArray(values) || values.length < 2) {
3 throw new RangeError('sparkline requires at least two data points');
4 }
5
6 const min = Math.min(...values);
7 const max = Math.max(...values);
8 const range = max - min || 1;
9 const pad = 2;
10 const innerW = width - pad * 2;
11 const innerH = height - pad * 2;
12 const stepX = innerW / (values.length - 1);
13
14 const points = values.map((value, i) => {
15 const x = pad + i * stepX;
16 const y = pad + innerH - ((value - min) / range) * innerH;
17 return [Number(x.toFixed(2)), Number(y.toFixed(2))];
18 });
19
20 const line = points.map(([x, y], i) => `${i === 0 ? 'M' : 'L'}${x},${y}`).join(' ');
21 const area = `${line} L${points[points.length - 1][0]},${height - pad} L${points[0][0]},${height - pad} Z`;
22 const [lastX, lastY] = points[points.length - 1];
23
24 return `<svg viewBox="0 0 ${width} ${height}" width="${width}" height="${height}" `
25 + `role="img" aria-label="sparkline from ${min} to ${max}">`
26 + `<path d="${area}" fill="${fill}" stroke="none" />`
27 + `<path d="${line}" fill="none" stroke="${stroke}" stroke-width="1.5" `
28 + `stroke-linejoin="round" stroke-linecap="round" />`
29 + `<circle cx="${lastX}" cy="${lastY}" r="2.5" fill="${stroke}" />`
30 + `</svg>`;
31}
01 / 01
STEP 01
‹ swipe to step through ›
Walkthrough
Space play
←→ step
click any line
Three takeaways
- 1Mapping data to pixels means normalizing values into a fixed range and flipping the y-axis for screen coordinates.
- 2Building SVG by hand is just assembling a path string plus attributes, no library required.
- 3Guarding inputs and reserving padding upfront keeps rendering math simple and safe.
Related explainers
javascript
function evaluate(expression) {
  const tokens = tokenize(expression);
  let pos = 0;
Building a recursive descent calculator
parsing
recursion
operator-precedence
Intermediate
8 steps
javascript
import { useState, useEffect, useCallback, useRef } from 'react';

const cache = new Map();
const inflight = new Map();
Building a stale-while-revalidate hook in React
caching
request-deduplication
custom-hooks
Advanced
10 steps
javascript
import { useEffect, useRef, useState } from 'react';

export function useDelayedFlag(active, delay = 300) {
  const [visible, setVisible] = useState(false);
Delaying a loading spinner with a React hook
custom-hooks
debouncing
cleanup
Intermediate
8 steps
javascript
const SWIPE_THRESHOLD = 80;
const MAX_TRANSLATE = 120;

export function attachSwipeToDismiss(element, onDismiss) {
Building a swipe-to-dismiss gesture in JS
touch-events
gesture-detection
dom-manipulation
Intermediate
10 steps
javascript
const { pool } = require('./db');

function withTransaction() {
  return async (req, res, next) => {
A per-request transaction middleware in Express
middleware
database-transactions
connection-pooling
Advanced
7 steps
javascript
function collapseConsecutiveLogs(lines, { keyFn = (l) => l.message } = {}) {
  const groups = [];

  for (const line of lines) {
Collapsing consecutive log lines in JavaScript
grouping
run-length-encoding
data-transformation
Intermediate
7 steps
Share this explainer
Here's the card — post it anywhere.
Made with highlit — turn any snippet into a walkthrough like this in about a minute.
Explain your code
Embed this explainer
Drop the interactive walkthrough into a blog or docs. Views never cost a credit.
<iframe src="https://highlit.co/explainers/rendering-a-sparkline-as-svg-explained-javascript-b6b0/embed?autoplay=1" width="100%" height="520" loading="lazy" style="border:0"></iframe>
Autoplay is on by default — add ?autoplay=0 to start paused.