python
44 lines · 7 steps
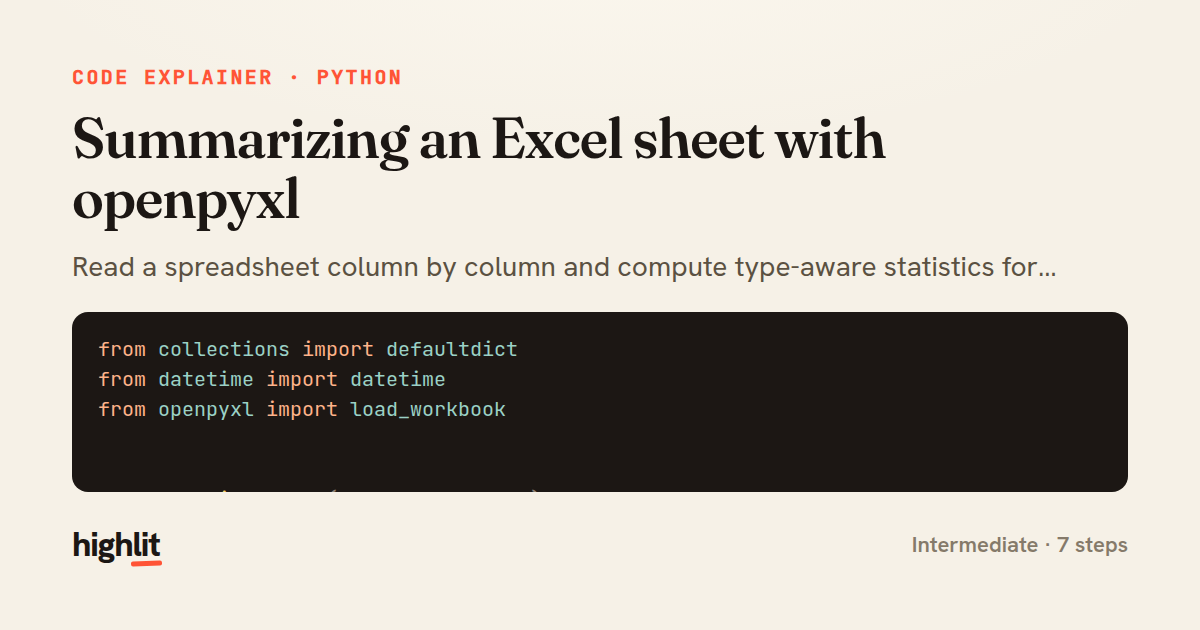
Summarizing an Excel sheet with openpyxl
Read a spreadsheet column by column and compute type-aware statistics for each one.
Explained by
highlit
1from collections import defaultdict
2from datetime import datetime
3from openpyxl import load_workbook
4
5
6def summarize_sheet(path, sheet=None):
7 wb = load_workbook(path, read_only=True, data_only=True)
8 ws = wb[sheet] if sheet else wb.active
9
10 rows = ws.iter_rows(values_only=True)
11 try:
12 headers = [str(h).strip() if h is not None else f"col_{i}"
13 for i, h in enumerate(next(rows))]
14 except StopIteration:
15 return {}
16
17 columns = defaultdict(list)
18 for record in rows:
19 for header, value in zip(headers, record):
20 if value is not None:
21 columns[header].append(value)
22
23 summary = {}
24 for header, values in columns.items():
25 numeric = [v for v in values if isinstance(v, (int, float))]
26 col = {"count": len(values), "missing": ws.max_row - 1 - len(values)}
27
28 if numeric:
29 col.update(
30 total=sum(numeric),
31 mean=round(sum(numeric) / len(numeric), 2),
32 minimum=min(numeric),
33 maximum=max(numeric),
34 )
35 elif any(isinstance(v, datetime) for v in values):
36 dates = [v for v in values if isinstance(v, datetime)]
37 col.update(earliest=min(dates), latest=max(dates))
38 else:
39 col.update(unique=len(set(values)))
40
41 summary[header] = col
42
43 wb.close()
44 return summary
01 / 01
STEP 01
‹ swipe to step through ›
Walkthrough
Space play
←→ step
click any line
Three takeaways
- 1Streaming rows with read_only and iter_rows keeps memory flat on large spreadsheets.
- 2Grouping values by column first lets you compute per-column stats in one clean pass.
- 3Branching on runtime type lets one summarizer handle numbers, dates, and text alike.
Related explainers
python
from fastapi import FastAPI, WebSocket, WebSocketDisconnect

app = FastAPI()
Building a WebSocket chat with FastAPI
websockets
broadcast
connection-management
Intermediate
9 steps
python
import time
import uuid

from django.utils.deprecation import MiddlewareMixin
Attaching per-request context in Django
middleware
request lifecycle
multi-tenancy
Intermediate
7 steps
ruby
class LogAggregator
  BUCKET_FORMAT = "%Y-%m-%dT%H:%M"

  def initialize(entries)
Bucketing log entries by the minute in Ruby
aggregation
hashing
enumerable
Intermediate
5 steps
ruby
class WeeklySignupsReport
  DEFAULT_WEEKS = 12

  def initialize(weeks: DEFAULT_WEEKS, source: User.all)
Building a weekly signups report in Rails
service object
aggregation
group by
Intermediate
7 steps
python
import random
from typing import Iterator, List
How reservoir sampling picks k items
reservoir-sampling
streaming
randomness
Intermediate
5 steps
php
<?php

namespace App\Services;
Building a cached daily leaderboard in Laravel
caching
aggregation
eager-loading
Intermediate
9 steps
Share this explainer
Here's the card — post it anywhere.
Made with highlit — turn any snippet into a walkthrough like this in about a minute.
Explain your code
Embed this explainer
Drop the interactive walkthrough into a blog or docs. Views never cost a credit.
<iframe src="https://highlit.co/explainers/summarizing-an-excel-sheet-with-openpyxl-explained-python-2fd0/embed?autoplay=1" width="100%" height="520" loading="lazy" style="border:0"></iframe>
Autoplay is on by default — add ?autoplay=0 to start paused.