python
38 lines · 6 steps
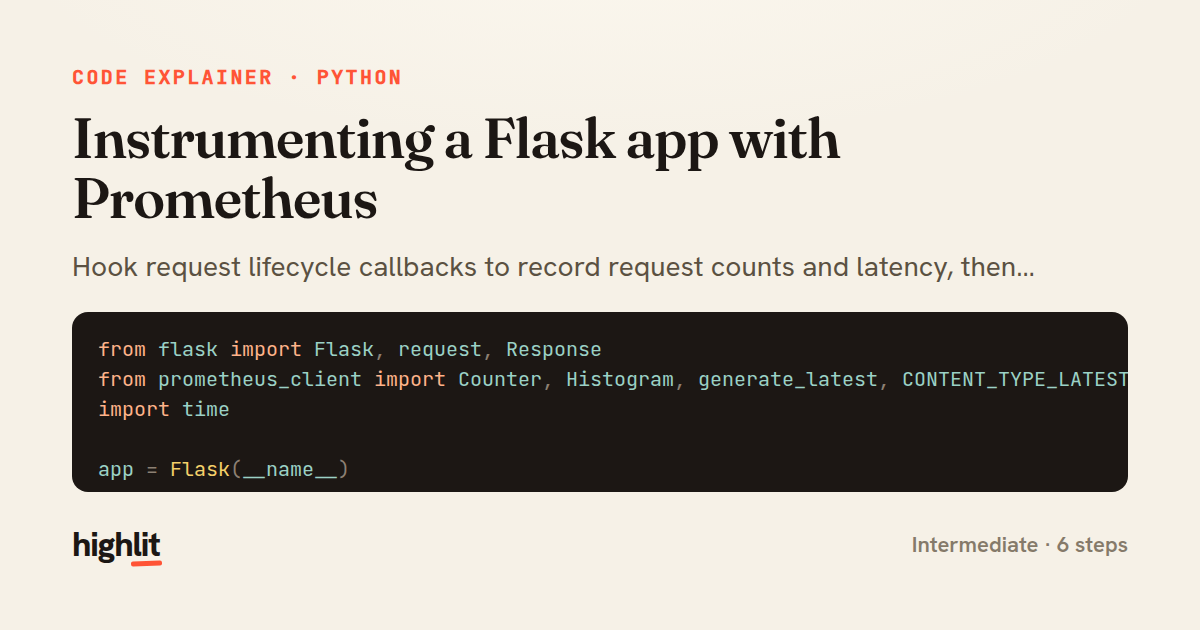
Instrumenting a Flask app with Prometheus
Hook request lifecycle callbacks to record request counts and latency, then expose them on a scrape endpoint.
Explained by
highlit
1from flask import Flask, request, Response
2from prometheus_client import Counter, Histogram, generate_latest, CONTENT_TYPE_LATEST
3import time
4
5app = Flask(__name__)
6
7REQUEST_COUNT = Counter(
8 "http_requests_total",
9 "Total number of HTTP requests",
10 ["method", "endpoint", "status"],
11)
12
13REQUEST_LATENCY = Histogram(
14 "http_request_duration_seconds",
15 "HTTP request latency in seconds",
16 ["method", "endpoint"],
17)
18
19
20@app.before_request
21def start_timer():
22 request._start_time = time.perf_counter()
23
24
25@app.after_request
26def record_metrics(response):
27 endpoint = request.url_rule.rule if request.url_rule else request.path
28 elapsed = time.perf_counter() - getattr(request, "_start_time", time.perf_counter())
29
30 REQUEST_LATENCY.labels(request.method, endpoint).observe(elapsed)
31 REQUEST_COUNT.labels(request.method, endpoint, response.status_code).inc()
32
33 return response
34
35
36@app.route("/metrics")
37def metrics():
38 return Response(generate_latest(), mimetype=CONTENT_TYPE_LATEST)
01 / 01
STEP 01
‹ swipe to step through ›
Walkthrough
Space play
←→ step
click any line
Three takeaways
- 1Prometheus client objects are declared once at module scope and mutated per request via label sets.
- 2Framework request hooks are a clean seam for cross-cutting concerns like timing every route.
- 3Using the matched url_rule instead of the raw path keeps metric label cardinality bounded.
Related explainers
python
from fastapi import FastAPI, WebSocket, WebSocketDisconnect

app = FastAPI()
Building a WebSocket chat with FastAPI
websockets
broadcast
connection-management
Intermediate
9 steps
python
import time
import uuid

from django.utils.deprecation import MiddlewareMixin
Attaching per-request context in Django
middleware
request lifecycle
multi-tenancy
Intermediate
7 steps
python
import random
from typing import Iterator, List
How reservoir sampling picks k items
reservoir-sampling
streaming
randomness
Intermediate
5 steps
python
import secrets

from django.contrib.auth import authenticate, login
from django.core.cache import cache
Two-factor login with OTP in Django
two-factor-auth
one-time-passwords
caching
Intermediate
9 steps
go
package middleware

import (
	"net/http"
Per-plan export limits in Gin middleware
middleware
rate-limiting
authorization
Intermediate
7 steps
python
import re
from functools import total_ordering
from typing import Optional
Parsing and comparing semantic versions
regex
operator-overloading
sorting
Intermediate
7 steps
Share this explainer
Here's the card — post it anywhere.
Made with highlit — turn any snippet into a walkthrough like this in about a minute.
Explain your code
Embed this explainer
Drop the interactive walkthrough into a blog or docs. Views never cost a credit.
<iframe src="https://highlit.co/explainers/instrumenting-a-flask-app-with-prometheus-explained-python-75cf/embed?autoplay=1" width="100%" height="520" loading="lazy" style="border:0"></iframe>
Autoplay is on by default — add ?autoplay=0 to start paused.