rust
42 lines · 7 steps
Prometheus request metrics in Axum
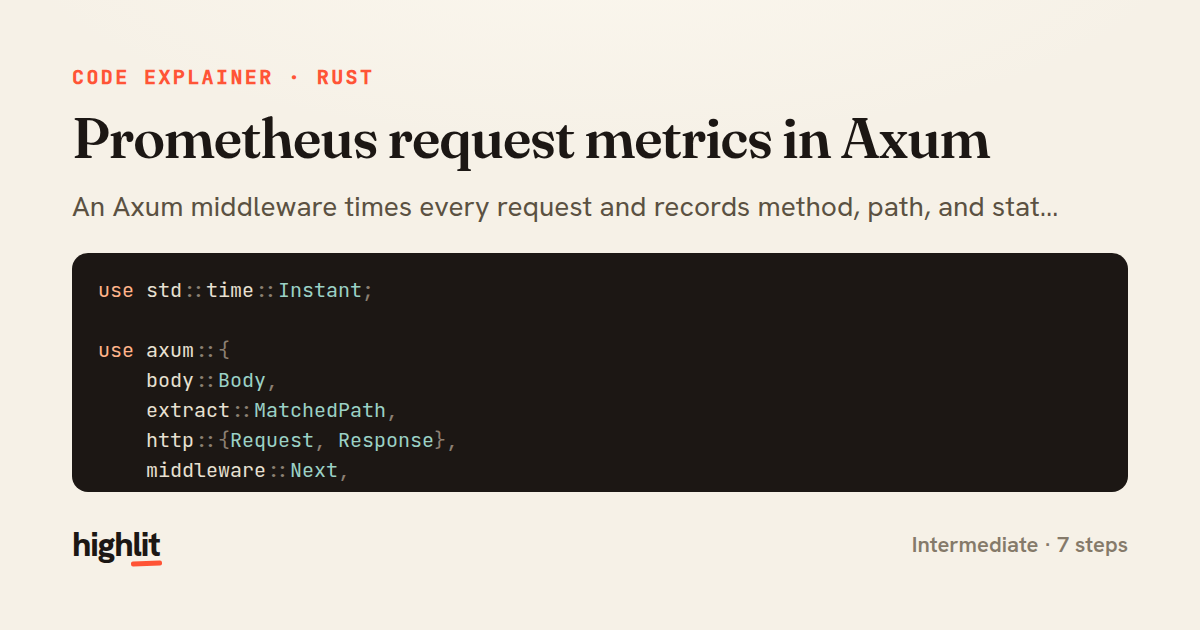
An Axum middleware times every request and records method, path, and status as Prometheus metrics.
Explained by
highlit
1use std::time::Instant;
2
3use axum::{
4 body::Body,
5 extract::MatchedPath,
6 http::{Request, Response},
7 middleware::Next,
8 response::IntoResponse,
9};
10use metrics::{counter, histogram};
11use metrics_exporter_prometheus::PrometheusHandle;
12
13pub async fn track_metrics(req: Request<Body>, next: Next) -> impl IntoResponse {
14 let start = Instant::now();
15 let method = req.method().clone();
16
17 let path = req
18 .extensions()
19 .get::<MatchedPath>()
20 .map(|p| p.as_str().to_owned())
21 .unwrap_or_else(|| "unmatched".to_owned());
22
23 let response: Response<Body> = next.run(req).await;
24
25 let latency = start.elapsed().as_secs_f64();
26 let status = response.status().as_u16().to_string();
27
28 let labels = [
29 ("method", method.to_string()),
30 ("path", path),
31 ("status", status),
32 ];
33
34 counter!("http_requests_total", &labels).increment(1);
35 histogram!("http_request_duration_seconds", &labels).record(latency);
36
37 response
38}
39
40pub async fn metrics_handler(handle: PrometheusHandle) -> impl IntoResponse {
41 handle.render()
42}
01 / 01
STEP 01
‹ swipe to step through ›
Walkthrough
Space play
←→ step
click any line
Three takeaways
- 1Middleware that wraps `next.run` can measure anything that spans the whole request lifecycle.
- 2Using `MatchedPath` instead of the raw URI keeps metric cardinality bounded to your route patterns.
- 3Separating recording from exposition lets one endpoint render everything the middleware collected.
Related explainers
rust
use serde::Deserialize;

#[derive(Debug, Deserialize)]
#[serde(untagged)]
Parsing flexible JSON shapes with serde
deserialization
enums
json
Intermediate
6 steps
rust
use std::cmp::{Ordering, Reverse};
use std::collections::BinaryHeap;
use std::fs::File;
use std::io::{self, BufRead, BufReader, BufWriter, Lines, Write};
K-way merge of sorted logs in Rust
binary-heap
k-way-merge
streaming-io
Intermediate
8 steps
python
import time
import uuid

from django.utils.deprecation import MiddlewareMixin
Attaching per-request context in Django
middleware
request lifecycle
multi-tenancy
Intermediate
7 steps
rust
use axum::{
    extract::{Path, State},
    response::sse::{Event, KeepAlive, Sse},
};
Streaming import progress with SSE in Axum
server-sent-events
streams
watch-channel
Advanced
7 steps
rust
use std::f64::consts::PI;

#[derive(Debug, Clone, Copy)]
pub struct LatLng {
Building geographic bounding boxes in Rust
geospatial
value-types
option
Intermediate
7 steps
rust
use chrono::{Duration, NaiveDate};

#[derive(Debug)]
pub struct DateRange {
Parsing and iterating date ranges in Rust
error-handling
iterators
parsing
Intermediate
7 steps
Share this explainer
Here's the card — post it anywhere.
Made with highlit — turn any snippet into a walkthrough like this in about a minute.
Explain your code
Embed this explainer
Drop the interactive walkthrough into a blog or docs. Views never cost a credit.
<iframe src="https://highlit.co/explainers/prometheus-request-metrics-in-axum-explained-rust-15a1/embed?autoplay=1" width="100%" height="520" loading="lazy" style="border:0"></iframe>
Autoplay is on by default — add ?autoplay=0 to start paused.